Grain Logistics
Mobile App
We helped a leading agricultural company create a prototype to help improve the Truck Turnaround Time during the harvest season. With a small window for harvest, avoiding bottlenecks for trucks delivering grain to their sites is critical.
We spoke with stakeholders, SMEs and drivers to understand their pain points and create a prototype that will streamline their processes.
Role
UX Designer
Team
Karlo Ticsay
+
1 x Lead UX / UI Designer
1 x Designer
1 x Data Analyst
Tools Used
Figma
Miro
Duration
Discovery Phase (6 weeks)
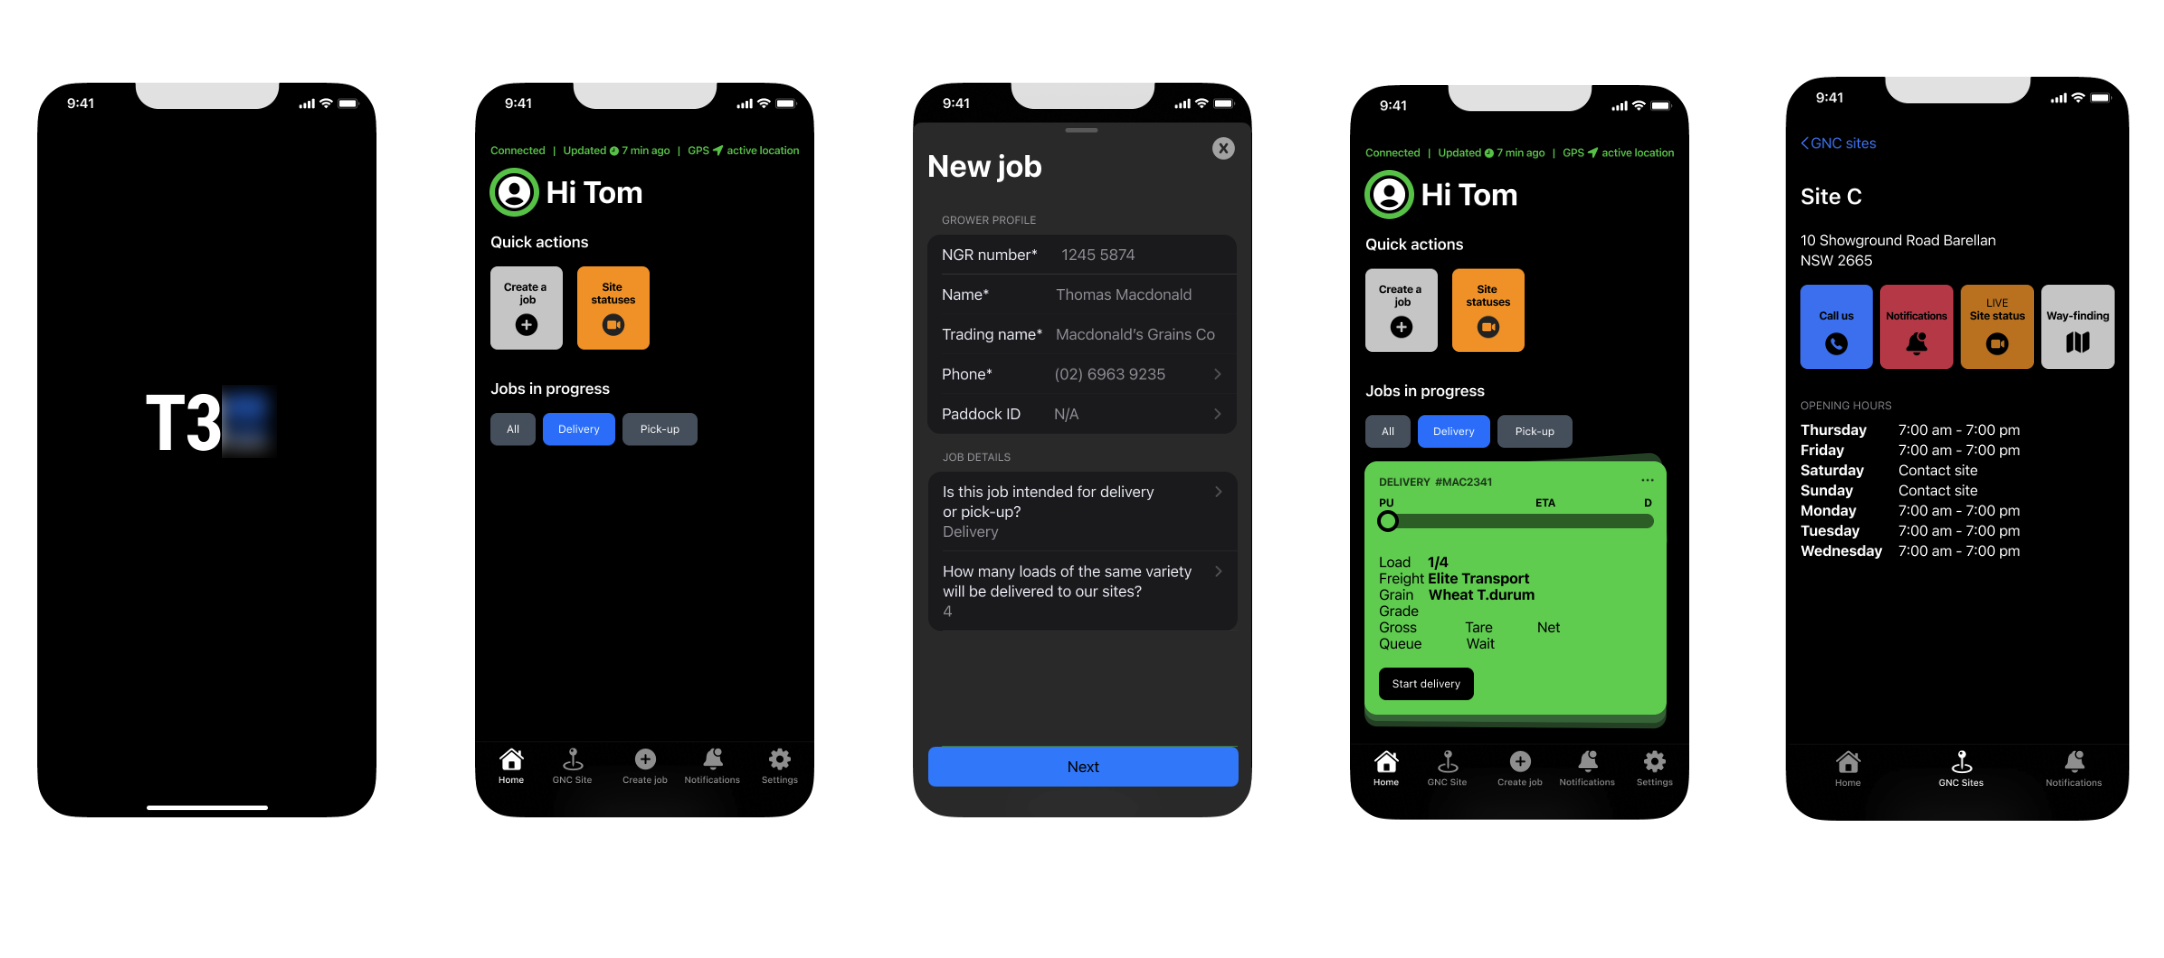
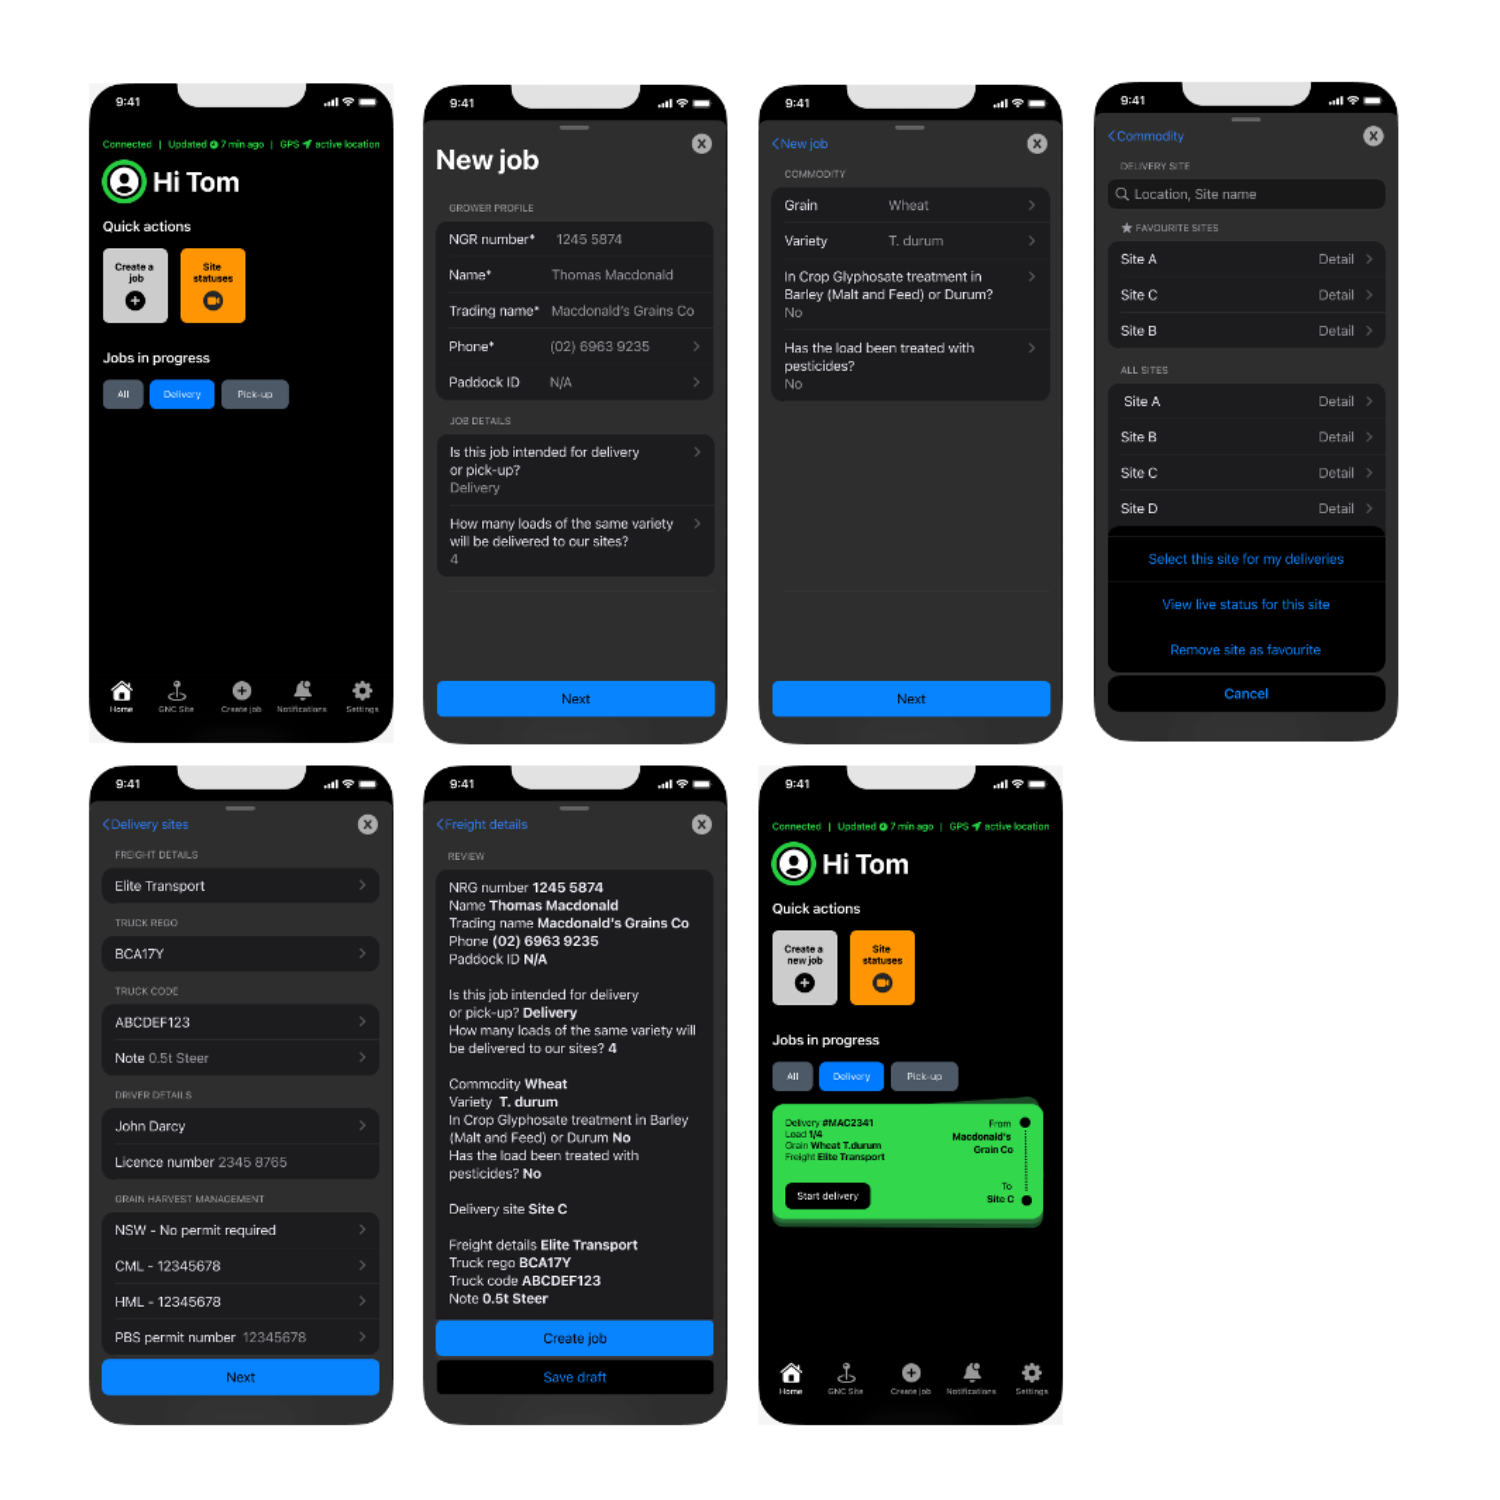
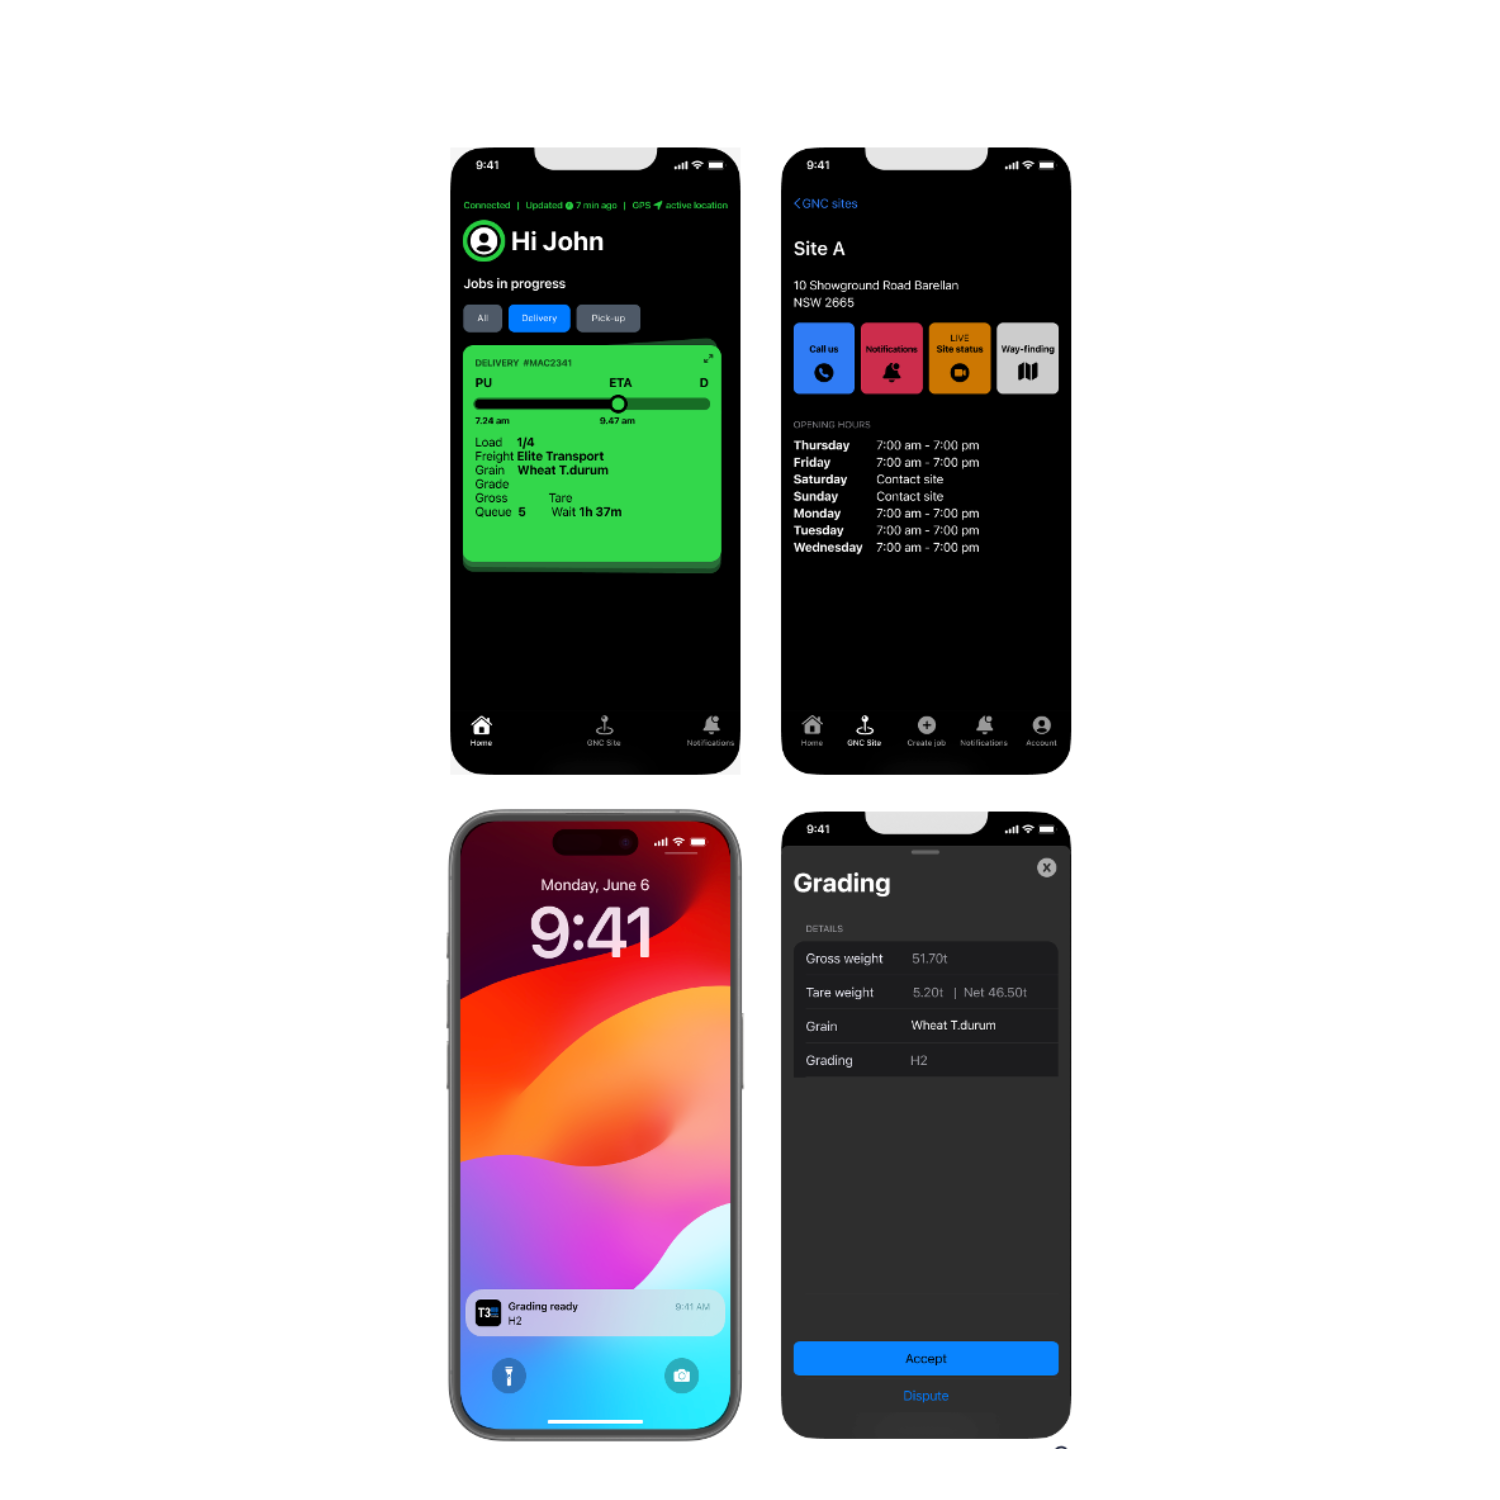
Pictured above: Views of the prototype screens*
Data / Integration
Technology
People Process
New job
New job
Delivery
4
Quick actions
Jobs in progress
DELIVERY #MAC2341
01. Overview
As part of a collaborative team, I worked with the agribusiness to improve operations during the harvest season, focusing on enhancing Truck Turnaround Time (TTT) at their grain delivery sites.
Objective: To streamline processes, reduce wait times and boost overall efficiency during the peak harvest season.
02. Problem
Through our discovery process we found the main challenge we faced was significant delays in processing trucks, especially during peak harvest times. Manual data entry, poor communication, and more imporantly lack of real-time data created bottlenecks, leading to slower truck turnaround and impacting the site's ability to operate smoothly.
03. Design Process
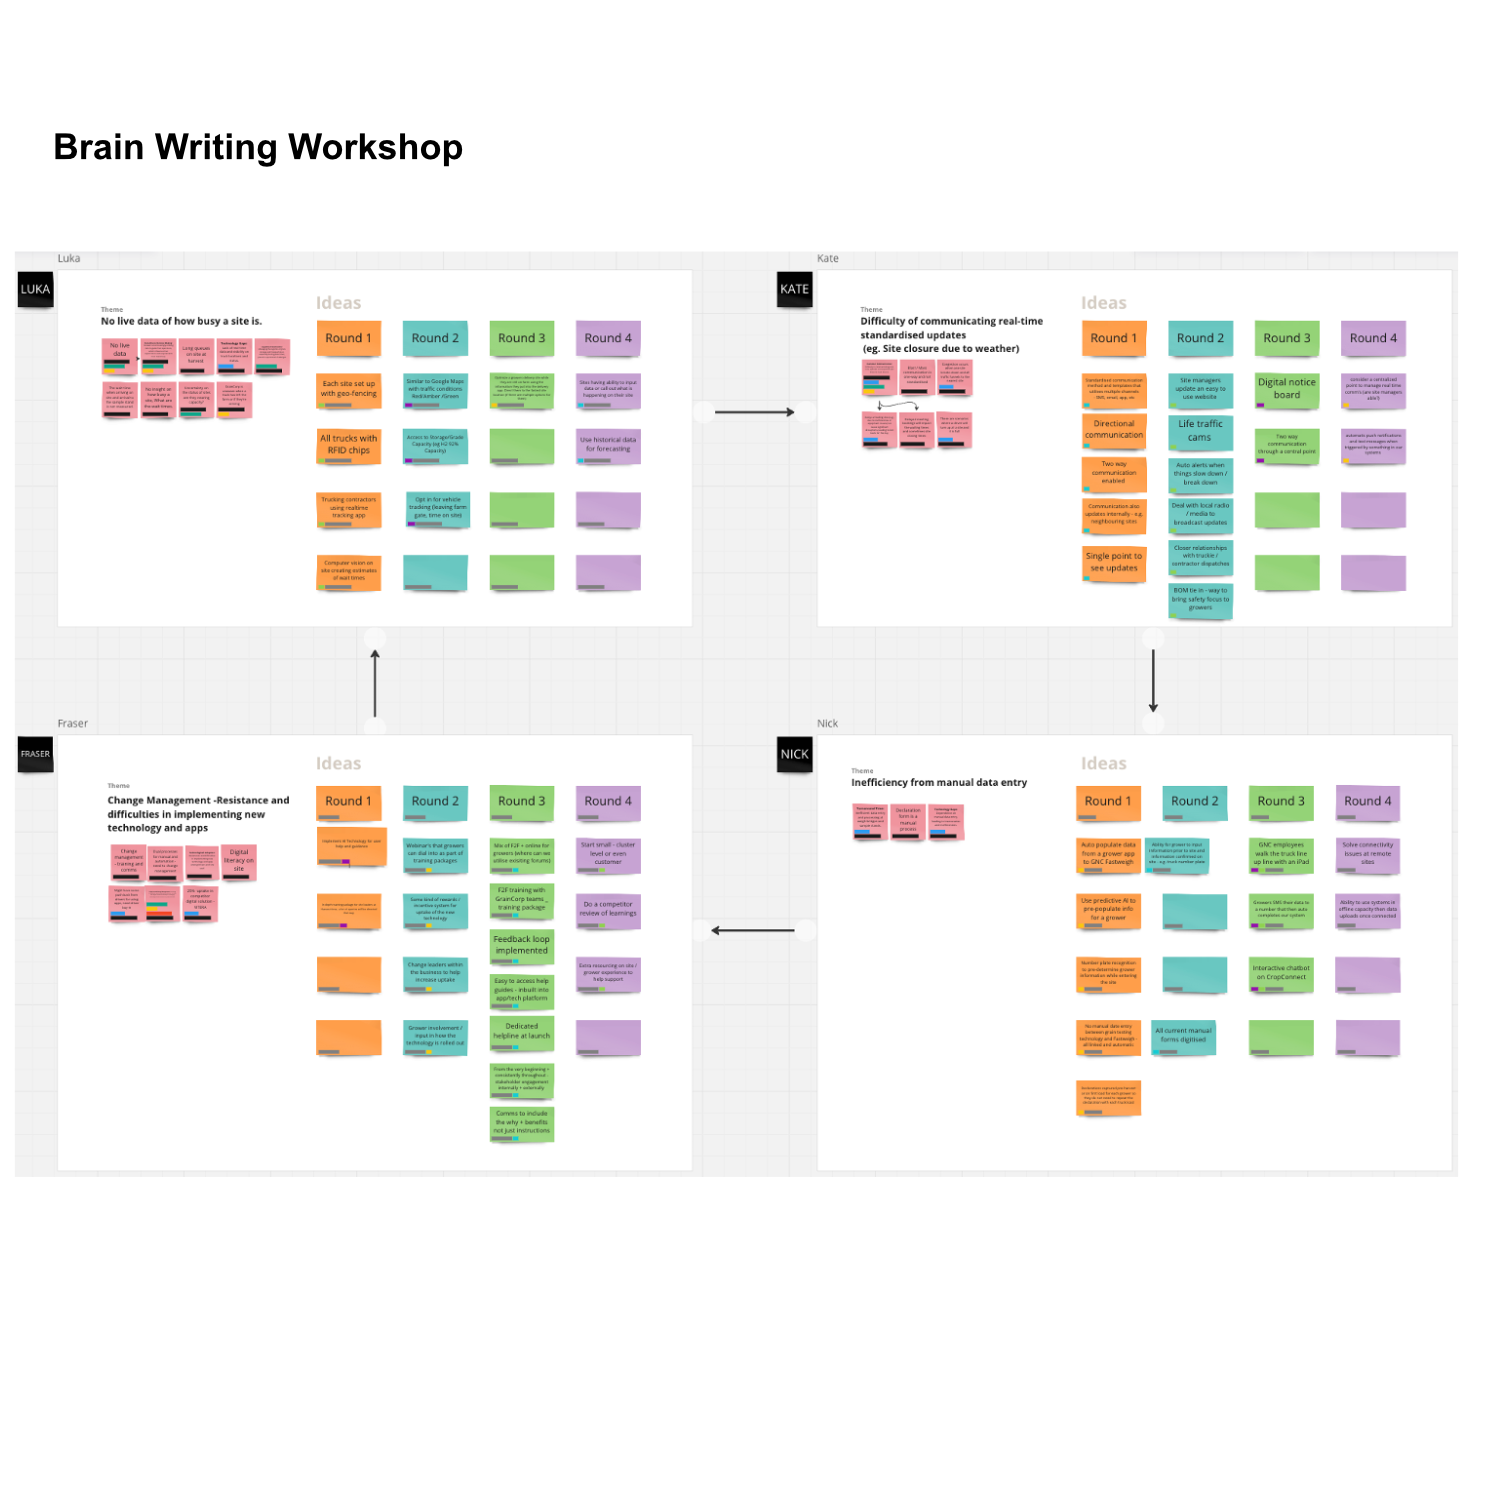
We undertook a site visit and facilitated workshops with key stakeholders to gain a clear understanding of existing workflows. Using a human-centred design approach, we mapped out the current processes and facilitated co-design workshops to brainstorm solutions. The focus was on improving communication systems and integrating real-time data. We developed wireframe prototypes, iterating based on user feedback. Our process was as follows:
Contextual Enquiry
Context Mapping
Desktop Research
Journey Mapping
Pain Point Prioritisation
Ideation
Feasibility vs. Value Prioritisation
User Flows
Prototyping
Backlog Creation
Strategic Roadmap

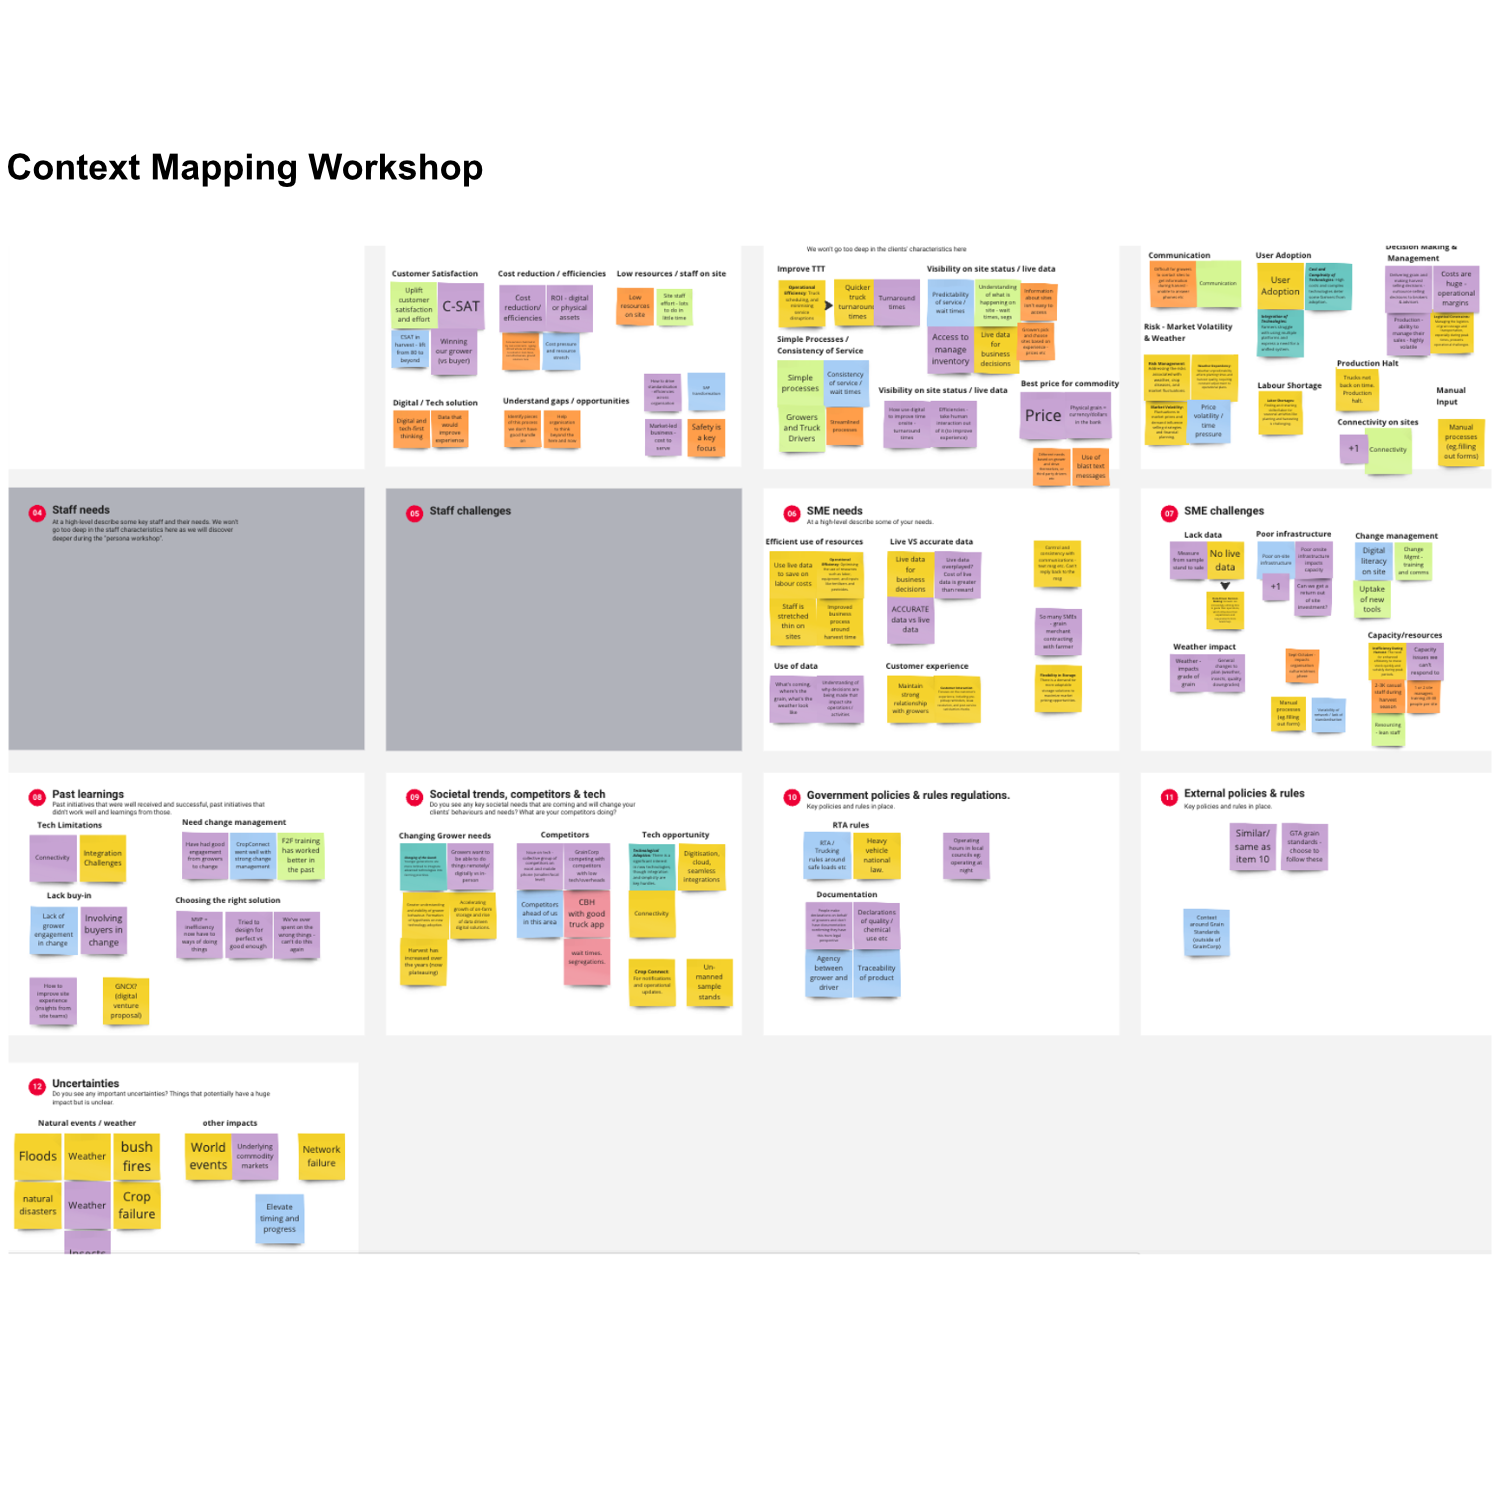
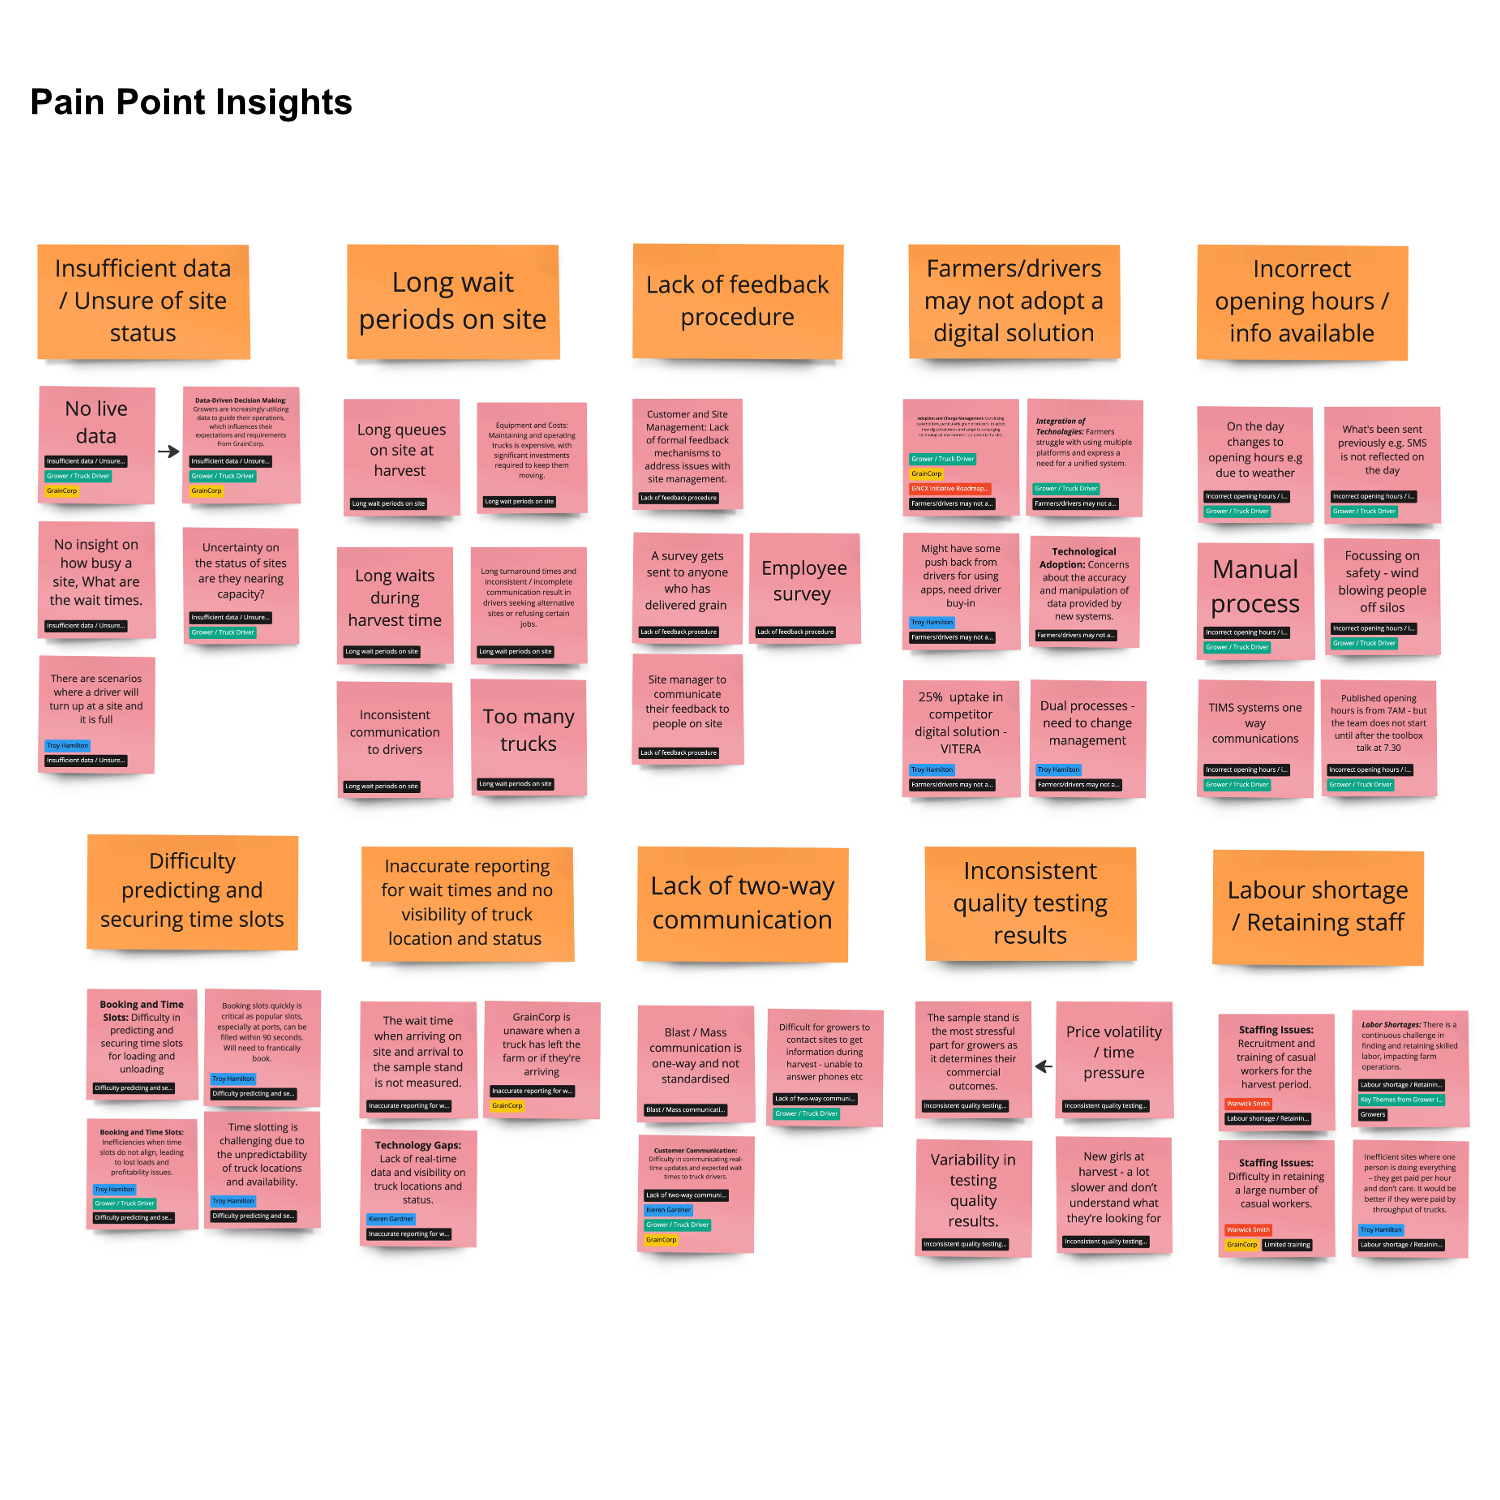
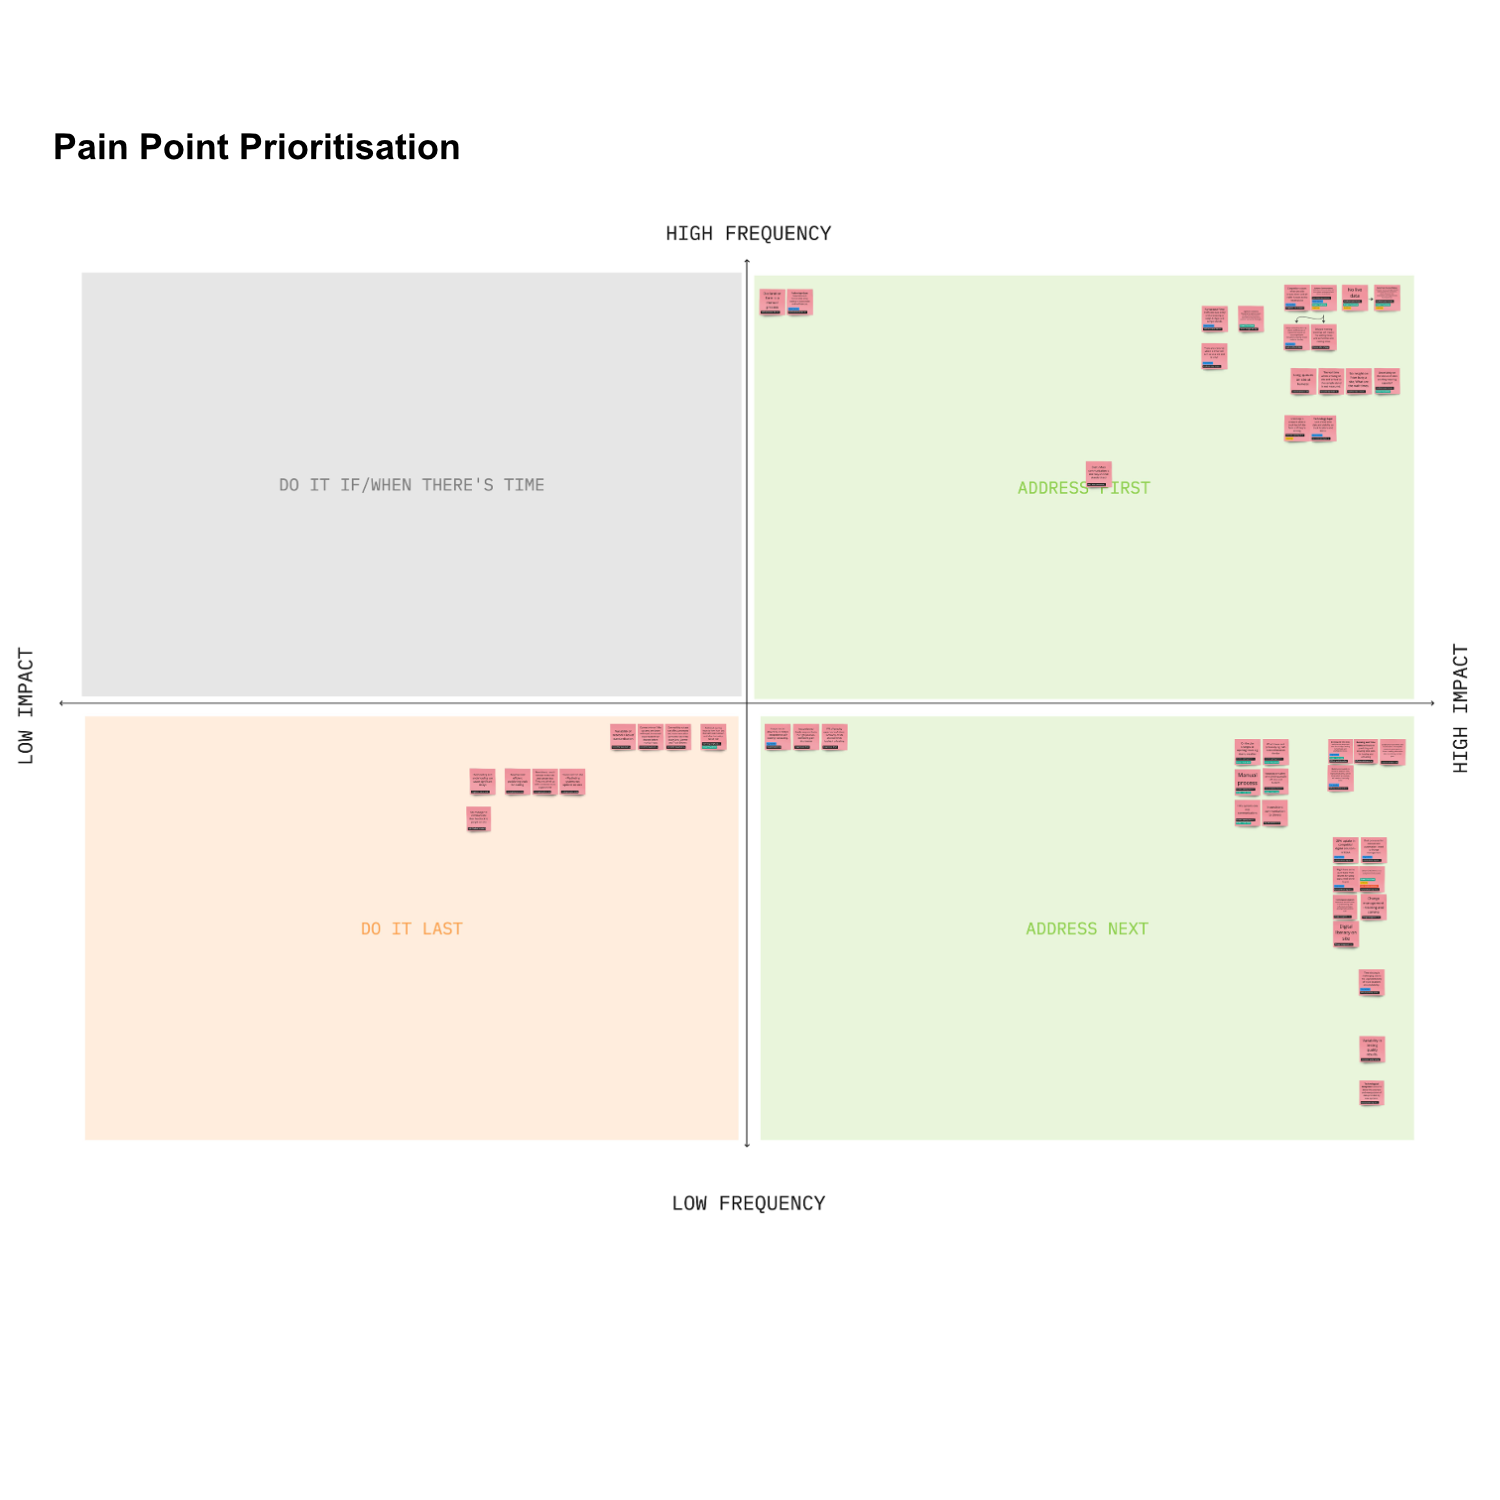

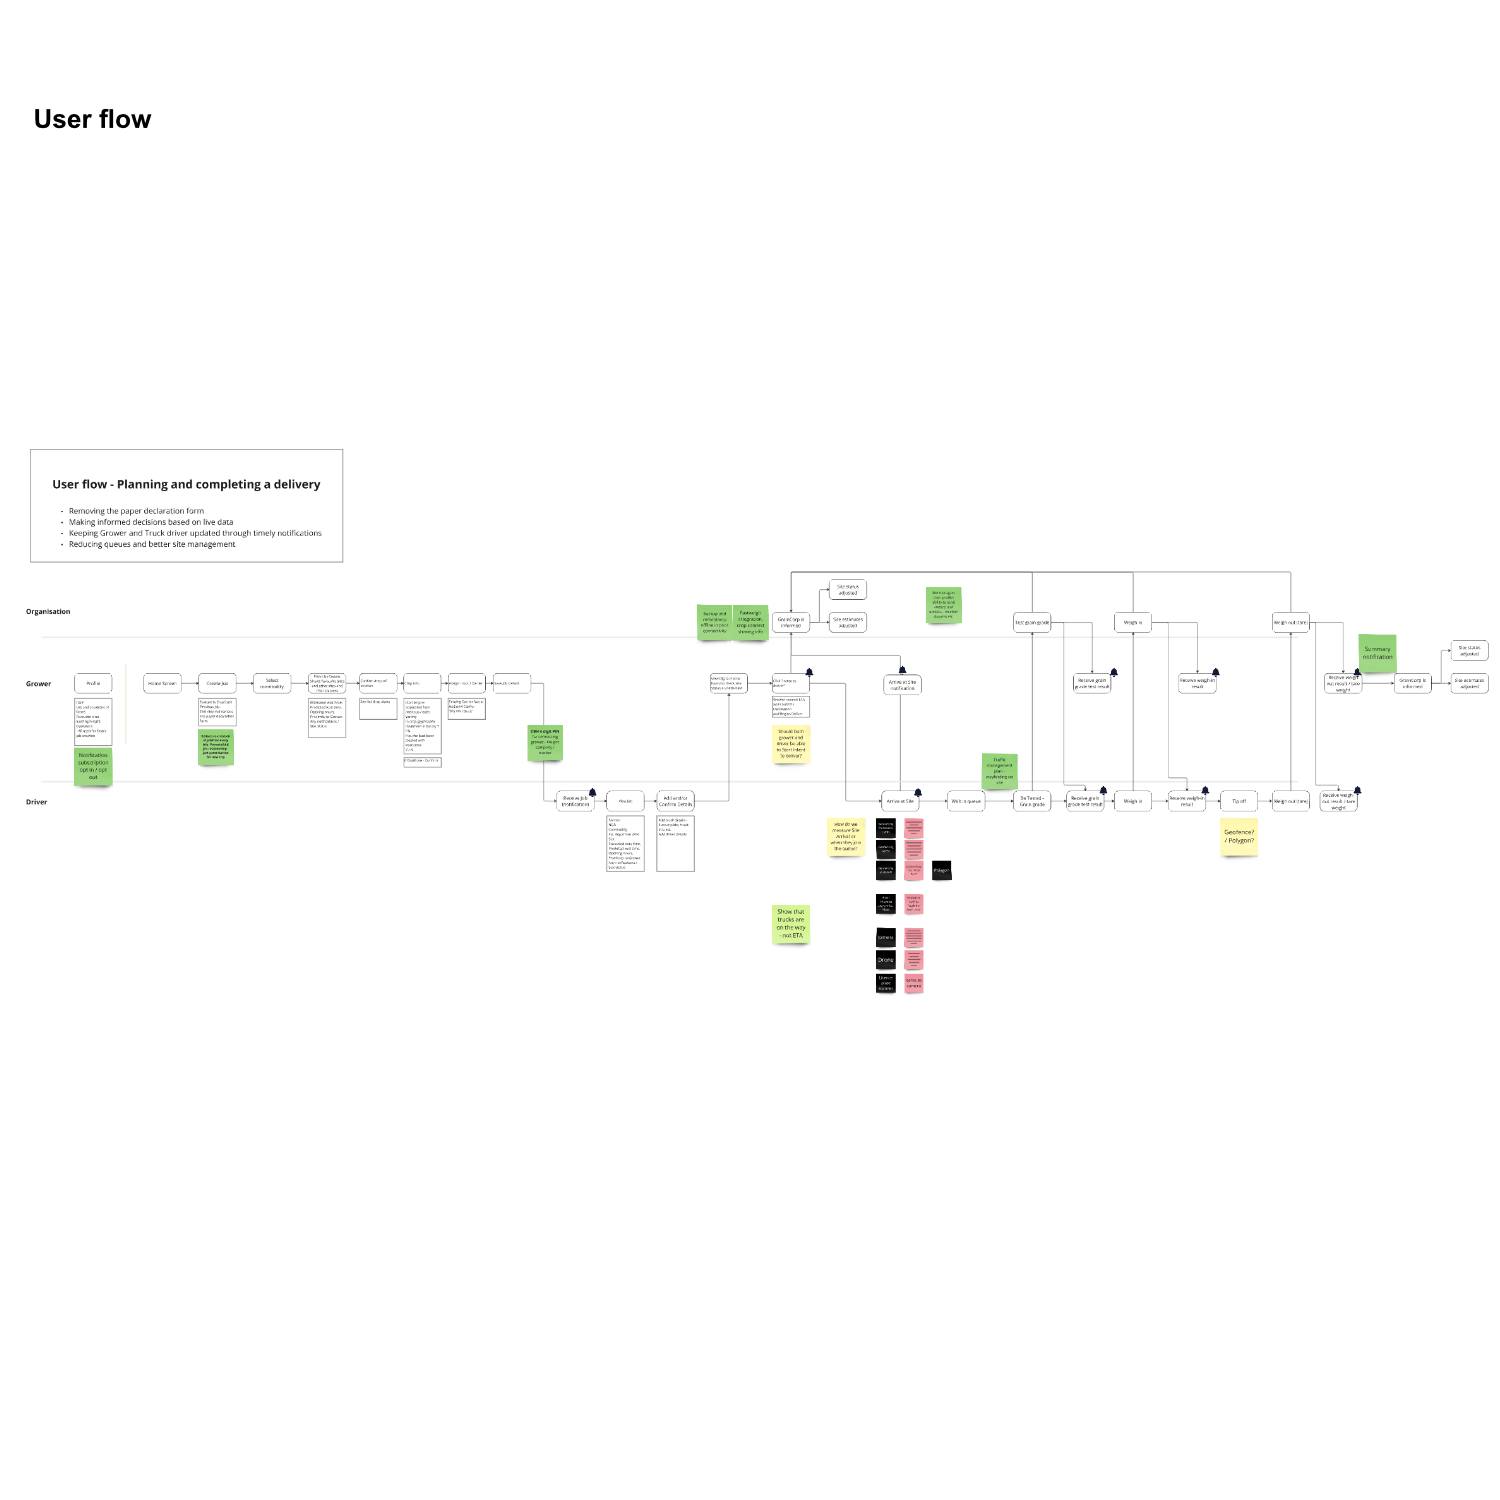
Pictured above: Views of the site visit and design discovery artefacts*
(Left to Right: Site Visit and Contextual Enquiry, Journey Map, Solution Prioritisation, High-Level User Flow.
04. Solution and Results
Our team delivered a digital platform prototype that could provide live data, streamlined truck check-ins, and improves communication between drivers and site staff.
Some sample pain points addressed by the prototype:
Pain Point #1 - Inefficiency from manual data entry.
Pain Point #2 - No live data of how busy a site is leading to slower decision making.
This solution could speed up decision-making that could lead to significantly lowered truck turnaround times and leading to a more efficient harvest operation and higher stakeholder satisfaction.