GrainCorp Truck Turnaround
Mobile App
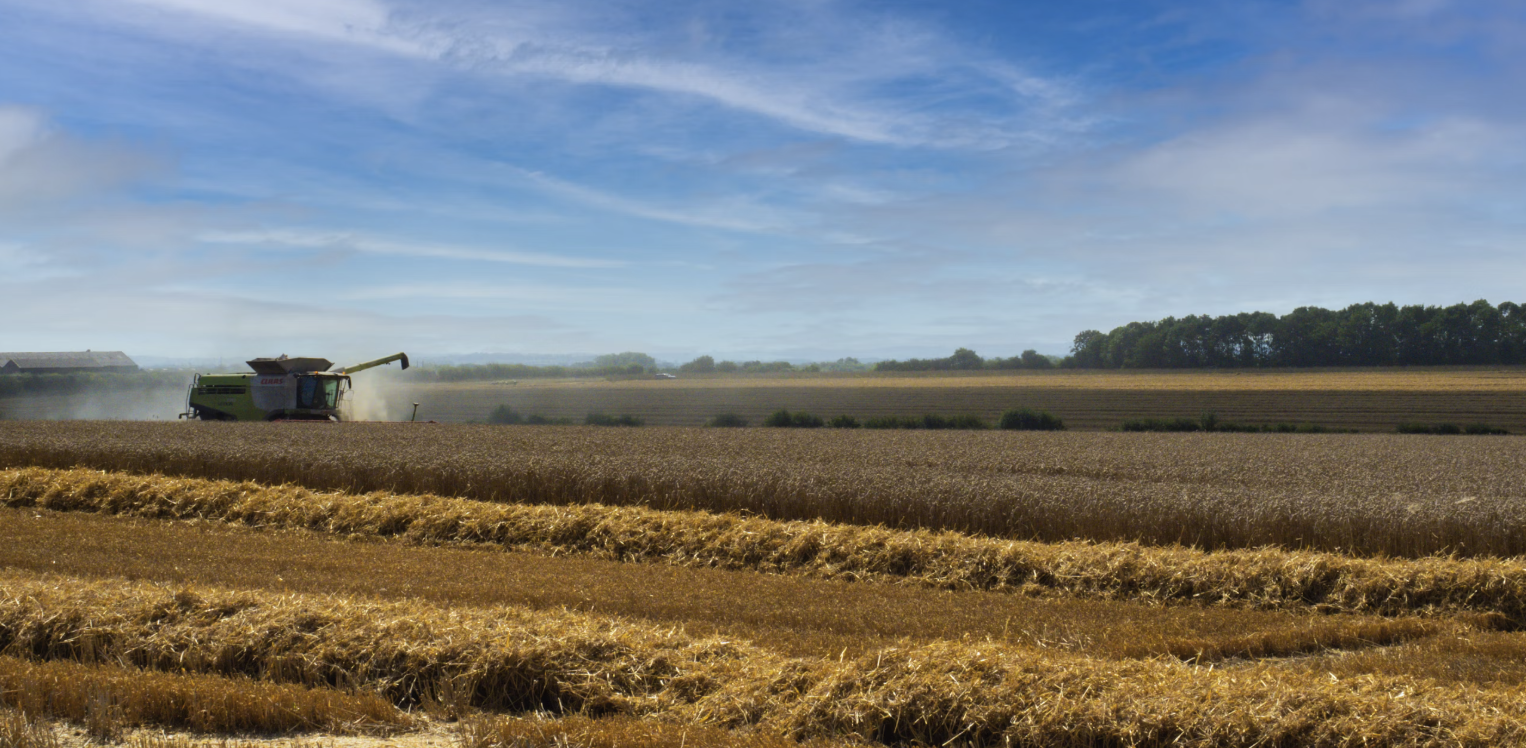
GrainCorp, a leading Australian agricultural company needed a prototype to improve Truck Turnaround Time during the harvest season. With a small window for harvest, avoiding bottlenecks for trucks delivering grain to their sites was critical.
To address this, a site visit, stakeholder workshops, SME consultations, and driver insights were gathered to understand key pain points. The resulting prototype was designed to streamline processes and enhance efficiency.

Role
Senior UX Designer
Team
1 x Principal Designer
1 x Lead UX / UI Designer
1 x Designer
Tools Used
Figma
Miro
MS Suite
Duration
Discovery Phase (6 weeks)
Project Timeline and Approach

Week 1: Discovery Kickoff
Kick-off
Site Visit
Context Mapping
Desktop Research

Week 2: Exploration
Desktop Research
Process Mapping

Week 3: Insights & Strategy
Pain Point Prioritisation

Week 4: Ideation
Solution Ideation
Solution Prioritisation

Week 5: Design
Wireframing & Prototypes
Internal review and refinement
Feedback

Week 6: Planning
Solution Backlog
Strategic Roadmap

Week 7: Wrap-Up
Deliverables Handover
01. Overview
Grain harvest in Australia runs on a tight and critical schedule, making logistics efficiency vital. Delays in Truck Turnaround Time (TTT) can lead to major losses for farmers, transporters, and storage providers.
Inefficiencies in TTT caused delays, congestion, and financial setbacks. As a Senior UX Designer, I collaborated with a cross-functional team to design and prototype a solution to:
Reduce truck turnaround
Enable real-time site visibility
Digitise manual paperwork
This proof of concept confirmed the need for a mobile-first platform to streamline grain deliveries and boost efficiency.
02. My Role
I led the end-to-end UX design process, including:
Conducting on-site and desktop research
Workshop facilitation
Creating current-state process maps
Wireframing and UI
03. Understanding the Problem
Each harvest season, thousands of trucks arrive at sites to unload grain, but inefficiencies caused significant delays.
Key Challenges
Long TTT Delays – Weighbridge and tip off bottlenecks and manual processes slowed operations.
Lack of Real-Time Visibility – Farmers had no insight into site congestion before arrival.
Manual Paperwork – Crop declarations and check-ins required physical forms.
Our research confirmed the need for a digital, data-driven solution to improve efficiency.


04. Research & Insights
The team conducted a site visit to Barellan NSW, I led the desktop research of existing resources, context workshops, and competitive analysis to define the solution.
Findings

On-Site Delays
Trucks can spend up to 3 hours on-site due to bottlenecks.

Lack of Live Status Updates
Without real-time updates, growers and drivers arrived uninformed.

Inefficient Manual Processes
Manual workflows created unnecessary delays in operations.
Process Maps
Process maps were created to visualise grain delivery and pickup workflows, identifying inefficiencies and opportunities for improvement (red sticky notes). By mapping key steps, task owners, and bottlenecks, these insights informed solution development to enhance efficiency during the critical harvest window.

“If I knew which site had shorter queues, I could plan my deliveries better and
complete more deliveries for the day.”
Driver
Competitive Benchmarking
We studied a comparable logistics platform from another provider, which improved efficiency through digital scheduling and queue tracking.
Painpoint Prioritisation
To ensure the most critical issues were addressed, pain points were prioritised based on frequency and impact. This approach helped focus efforts on solving the most pressing inefficiencies that affected farmers, truck drivers, and site operators.
Pain points from the “Address First” and “Address Next” quadrants and grouped in the following:
No live data of how busy a site is
Difficulty of communicating real-time standardised updates
Inefficiency from manual data entry

5. Designing the Solution
Brainwriting Workshop
I facilitated a brainwriting workshop, an ideation exercise where SMEs take turns refining each other’s ideas to address the prioritised pain points from the Address First and Address Next quadrants.
We designed a mobile-first platform with three core features:
Real-time site visibility
Digital job creation & automation
Alerts & notifications

Solution Prioritisation
To determine the best starting point for the solution, high-value ideas were identified based on their potential to alleviate pain points, reduce organisational risk, and ensure feasibility from both a technical and operational standpoint.
SMEs assessed the value of each solution, while a technical expert provided insights into feasibility, ensuring a balanced and strategic approach to implementation.

Focused Features

Real-Time Site Visibility
Live queue updates for better scheduling
Alternative site recommendations based on congestion

Digital Job Creation & Automation
Paperless crop declarations and check-ins
Pre-filled truck and grower profiles for faster processing

Alerts & Notifications
Real-time alerts for site closures, weather changes, and delays
6. Prototyping & Testing
Wireframes were tested with SMEs and mid-fidelity screens were iterated based on feedback.
Key Refinements
Simplified queue tracking for clarity
Reduced manual inputs in job creation
More intuitive navigation based on user feedback
Timely notifications to avoid overwhelming the user
Final UI examples
Active Monitoring with a map view of current location
Notification preferences for the users to choose relevant alerts
Next load planning to plan for subsequent loads and check status

1. Tom starts delivery
Grower Tom sees the stacked job card and presses “Start delivery” to pre-submit the load details and estimated arrival time (ETA) to GrainCorp.
→ This replaces manual handoffs, reducing paperwork and admin delays.
2. ETA & site conditions update in real time
Tom sets the departure time. The app calculates a live ETA and displays site queue length and estimated wait times.
→ Solves lack of live status updates by helping Tom and John avoid long queues.

3. Tom gets an alternate site suggestion
Concerned by long wait times at Site A, Tom taps “Alternate site suggestion”. He’s offered Site C, which is farther but has less congestion.
→ Helps reduce on-site delays by directing trucks to the most efficient location.
4. Job updates instantly across parties
Tom confirms Site C. GrainCorp is instantly notified of the updated ETA and details. The driver’s job record is automatically synced.
→ Streamlines communication and avoids delays from outdated info.
07. Next Steps & Future Impact
Future Impact & Next Steps
Measure Impact & User Testing – Conduct further testing to validate assumptions and refine the solution based on real-world feedback.
Pilot Deployment at Selected Sites – Implement the proof of concept at chosen locations to analyze real-time efficiency gains.
Expand Functionality – Enhance offline capabilities and introduce AI-driven queue prediction for better scheduling and automation. for low-connectivity areas
08. Final Thoughts
This proof of concept demonstrated how UX-driven solutions can streamline logistics, reduce delays, and improve efficiency for farmers, truck drivers, and site operators.